Artificial intelligence for probabilistic identification and clustering of ions in atom probe tomography
Atom probe tomography is a powerful material analysis technique capable of reconstructing 3D positions of the atoms constituting the investigated sample. It relies on the analysis of mass-spectrometry data [D.J. Larson et al., “Local Electrode Atom Probe Tomography”, (Springer, NY) (2013); Kelly T.F., Larson D.J., Annu. Rev. Mater. Res., 42, 1 (2012)] and requires preliminary establishing of correct correspondence between the peaks in the spectrum and the particular atomic species. This peak identification (labeling) procedure is crucial for accurate interpretation of the measured data [Haley D. et al., Ultramicroscopy, 159, 338 (2015); Hudson D. et al., Ultramicroscopy, 111, 480 (2011)].
Despite rapid penetration of computer technologies practically in any area of data analysis, manual peak labeling still remains the main technique for mass spectrum peaks identification. The procedure is time-consuming and vulnerable to errors [Hudson D. et al., Ultramicroscopy, 111, 480 (2011)]. Also, it is extremely difficult to take into account all the available information about the sample, the measured data, and the possible correlations between detection of different ion spices simultaneously during manual analysis. Traditionally, manual methods rely on unique mapping of each observed mass-to-charge ratio onto a particular kind of ions (or background signal). Such analysis loses accuracy if (i) some mass-spectrum peaks overlap because of instrumental effects or (ii) certain peaks are shared by several ions (i.e. close peaks with Δm/q ~ 0.01 Da are not resolved). The first of the issues can be addressed by probabilistic treatment of the accumulated mass spectrum [Vurpillot F. et al., Microscopy and Microanalysis, 25, 367 (2019)], while shared peaks can acquire natural probabilistic interpretation when analyzed by Bayesian approach to automatic spectral patterns recognition [Mikhalychev A., Ulyanenkov A., J.Appl. Cryst., 50, 776 (2017)], previously developed for the analysis of powder X-ray diffraction data.
Atomicus team has shown that employing artificial intelligence can both enable automation of the peak identification procedure, where an intuitive approach is replaced by a mathematically formalized algorithm, and improve the results of reconstructing the 3D composition of the sample by including into consideration all the available information about its spatial structure.
First, we apply Bayesian approach to analysis of the accumulated mass spectrum. The key idea of the developed technique is to rank ions according to their probabilities, calculated from Bayes’ formula and conditioned by the measured data (Figure 1). More specifically, the initial information about the investigated specimen (e.g. presence or absence of some elements, correlations between certain ions’ detection, etc.) is encoded in prior probabilities of ions and their combinations. The expected inaccuracies of the measurement and peak search are quantified by the likelihood function. Based on the measured data, posterior probabilities are calculated for the specimen models (combinations of ions, possibly describing the actual measured data). The posterior probability for an ion is defined as the total probability of all the models, containing such ion, and can be estimated even without actual construction of all those models (Figure 2). If several ions have already been accepted as appropriate by the user, only the models containing those selected ions are taken into consideration. For each combination of ions, the corresponding optimal peak labeling is chosen by maximization of the measured mass spectrum likelihood.
According to the described peak labeling technique, certain peaks can be associated with multiple ions due to overlap of their isotopic mass-to-charge ratios. Instead of traditional deterministic “ranging” [D.J. Larson et al., “Local Electrode Atom Probe Tomography”, (Springer, NY) (2013); Kelly T.F., Larson D.J., Annu. Rev. Mater. Res., 42, 1 (2012); Haley D. et al., Ultramicroscopy, 159, 338 (2015); Hudson D. et al., Ultramicroscopy, 111, 480 (2011)], the mass-to-charge ratios are treated probabilistically by taking into account multiple associations and overlap of neighbor peaks caused by instrumental effects. The finite decision on identities of the ions is postponed until we know more about their local surroundings. Then, “smart” identification of individual ions is performed by learning from their neighborhood: the probabilities of assigning ion identities to mass-to-charge ratios are updated locally. The proposed approach combines probabilistic analog of ranging, all a priory information (coded in prior probabilities), correlations between ions presence, and a posteriori information about local clustering learnt from the already identified structure. This AI-driven technique can supersede manual analysis by analyzing large amounts of information and making automatic decisions about atoms identity.
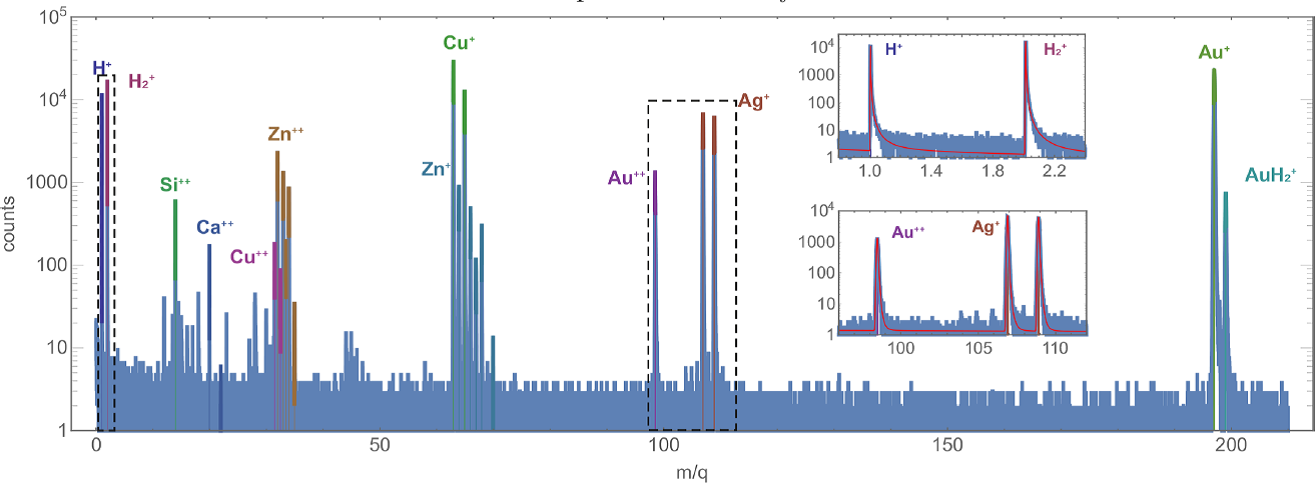
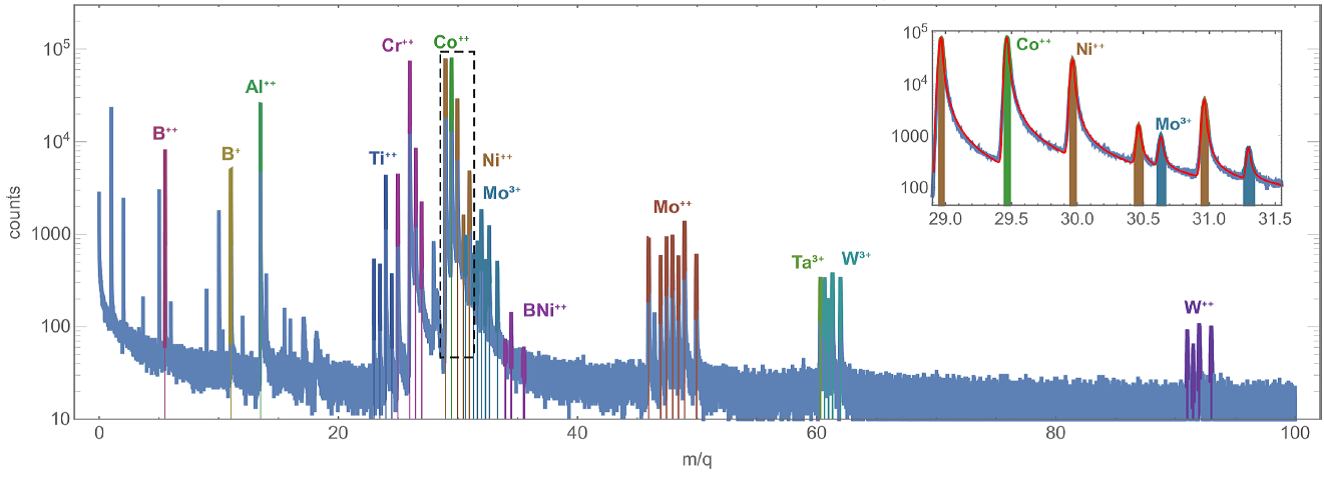
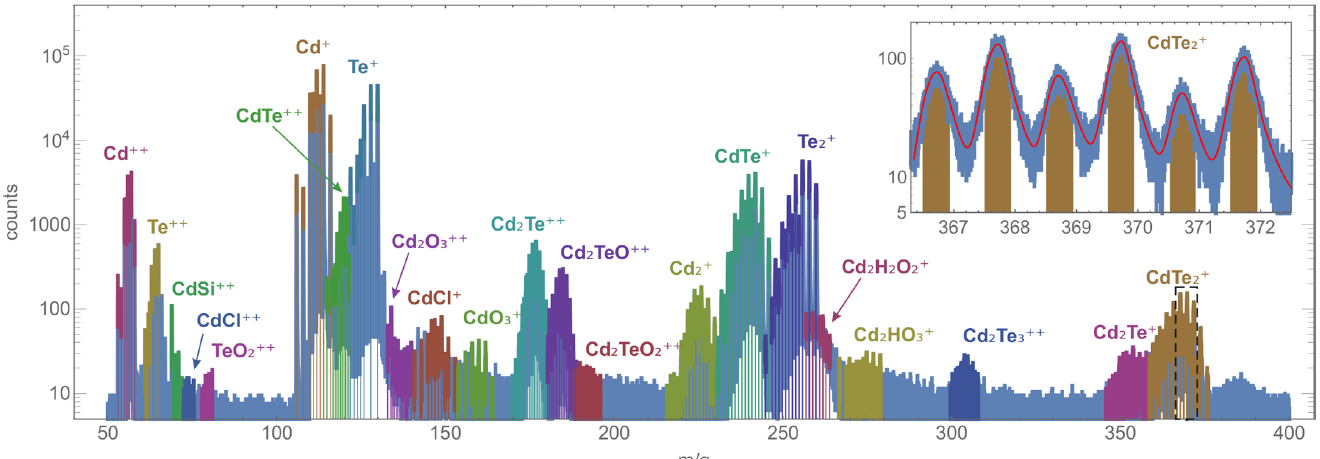
First, the designed approach has been applied to the problem of automatic peak labeling of several time-of-flight mass-spectrometry datasets, measured for inorganic samples (alloys and semiconductors). Each mass spectrum was iteratively analyzed by accepting one of the top-ranked ions at each step. A simple approach, when each ion was ranked according to the measured data and the already accepted ions only, was compared with “smart” peak labeling, when the higher probabilities of observing correlated ions groups (e.g. Te+ together with Te++, Te2+, and TeO+) were taken into account. As one would expect, including the additional information into the analysis increased the quality of the obtained results and enabled reliable construction of sample models, consistent with the results of manual analysis (some examples of the analyzed mass spectra are shown in Figure 3).
Then, “smart” identification of ions according to the information about their surrounding has been tested on several synthetic datasets. Figure 4 shows an example, where the concentrations of zinc, cadmium, and tellurium are chosen is such a way that the line at 64 Da, shared by Zn+ and Te++, completely hinders correct inference of the sample structure by the traditional one-to-one range-ion mapping. The advanced AI-based approach successfully handles that peak overlap problem and yields accurate results. Figure 5 illustrates the situation, when a mass-spectrum peak is hidden by another ion’s peak because of the instrumental broadening. Artificial intelligence uses local spatial information to resolve the overlapping peaks more accurately and significantly reduces the probability of erroneous ion identification.
The results (Bayesian approach to mass-spectrum peak identification) are published in the following paper: Mikhalychev A., Vlasenko S., Ulyanenkov A., Ultramicroscopy, 215, 113014 (2020) (https://www.sciencedirect.com/science/article/abs/pii/S0304399119303316).

Figure 1. Schematic illustration of the Bayesian approach to ranking of candidate ions.

Figure 2. Calculation of a candidate ion rank (figure of merit) as a sum of the posterior probabilities of all the models, containing the ion.


Figure 3. Analysis results (the mass spectra with the identified ions) for the alloy and semiconductor samples: gold (top) and nickel-chrome (middle) superalloys and cadmium telluride (bottom). Insets show magnified parts of the mass spectra (indicated by dashed rectangles). Red curves in the insets show the analytical fitting of the mass spectra peaks by Gauss-Pearson profiles.

Figure 4. Application of the traditional and the artificial intelligence-based approaches to a synthetic dataset with a peak shared by two ions.

Figure 5. Application of the traditional and the artificial intelligence-based approaches to a synthetic dataset with peak overlap caused by instrumental broadening.


